

From fragmented data to AI-driven purchasing for a top 100 seller

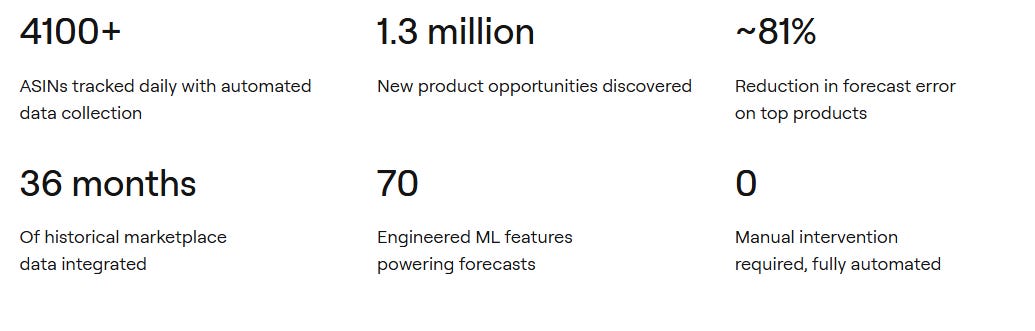
A top 100 Amazon reseller specializes in athletic apparel and footwear, with an annual revenue of approximately $25 million. Their catalog spans over 4,200 product listings across 16 brands, with Nike representing roughly 88% of their sales volume.
On a typical day, they move around 1,450 units and maintain approximately 98,000 units in stock.
Their main product categories include athletic apparel, like jackets, joggers, tees, hoodies, and shorts. They also sell footwear, like training shoes and cleats. They sell sports accessories too. Smaller segments include outdoor gear, luggage, and home goods.
The business is highly seasonal. Q4 holiday demand drives nearly four times the volume of an average month. December alone accounts for over 160,000 units shipped.
The story
The company (redacted for privacy) is a high-volume Amazon seller managing thousands of ASINs across competitive product categories. They came to Islands with a clear goal: stop making buying decisions based on gut feel and spreadsheets. They wanted to build a system that tells them what to buy, how much, and when. The system would be backed by data and machine learning.
The problem? None of that was possible with what they had. There was no structured historical database. Data was scattered across disconnected sources with gaps, no unified schema, and no automated collection. Purchasing decisions were based on manual checks and basic equations.
They needed the entire stack built from scratch: the data layer, the intelligence layer, and the decision layer. That’s what we built.
The challenge
No data infrastructure
Data was scattered across disconnected sources. Sales history had gaps spanning months. Inventory records were incomplete. 99.4% of products had zero recorded sales - the system couldn’t distinguish a dead product from a data gap
No forecasting capability
Without clean time-series data, there was no way to train, evaluate, or deploy a forecasting model. Purchasing was entirely manual
No market visibility
They also could not tell if a new opportunity was real. Portfolio expansion was based on intuition, not intelligence.
Phase 1
Data foundation
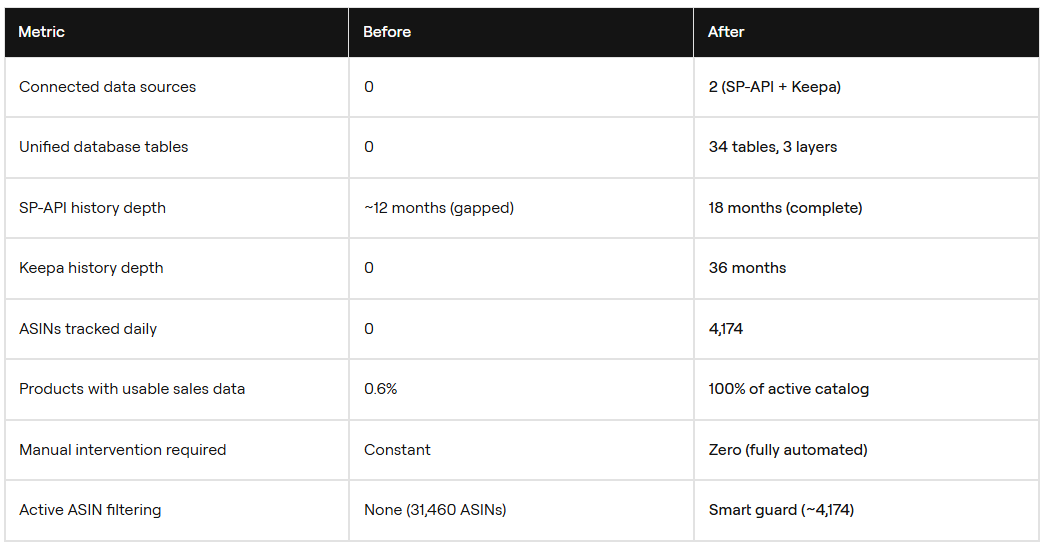
We built a three-layer PostgreSQL data warehouse that pulls from two key sources.
One source is the Amazon SP-API. It provides seller data like orders, inventory, returns, traffic, and fees.
The other source is Keepa. We parse it into 18 structured tables.
These tables feed 28 marketplace features into our models.
To keep data flowing reliably, we built custom retry logic with exponential backoff. We also added required cooldowns between endpoint types. We built resumable backfill loops that can survive crashes. We also built an Active ASIN Guard. It filters 31,460 ASINs down to about 4,174 active ones. This helps us spend enrichment tokens only where they matter.
Phase 2
ASIN discovery & enrichment
We built a discovery pipeline with Keepa’s Finder API.
It uses a custom sliding window and binary search.
This lets us scan full brand catalogs on Amazon.
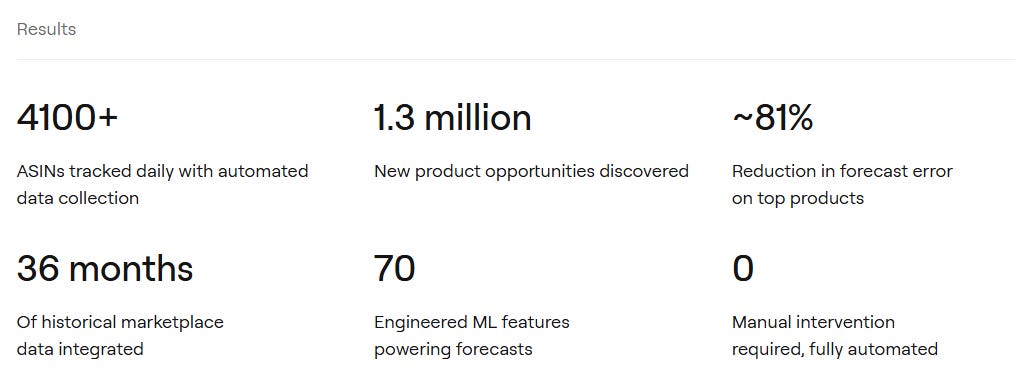
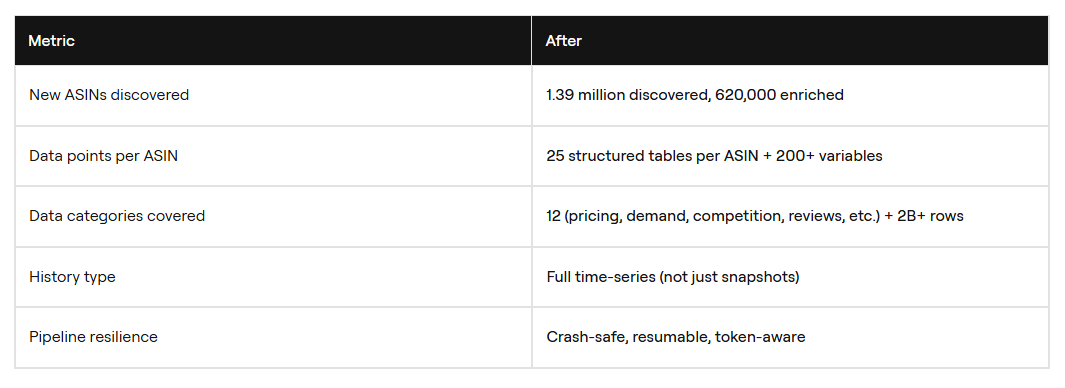
It also bypasses the platform’s 10,000-result cap. This allowed us to discover over 1.39 million ASINs across multiple brands.
From there, the enrichment pipeline pulls the full product data for each ASIN. It then parses the data into 25 structured relational tables. To date, 620,000 ASINs have been fully enriched with complete time-series history.
Phase 3
Forecasting & Purchase Order Intelligence
With 91.9% of daily sales values at zero, accurate forecasting required a careful approach. We tested many model families before choosing a per-ASIN ensemble that picks the best model for each product.
The top performers are LightGBM Two-Stage and Amazon Chronos-2.
LightGBM Two-Stage uses a binary classifier with an AUC of 0.807.
It pairs that classifier with a Tweedie regressor across 111 features.
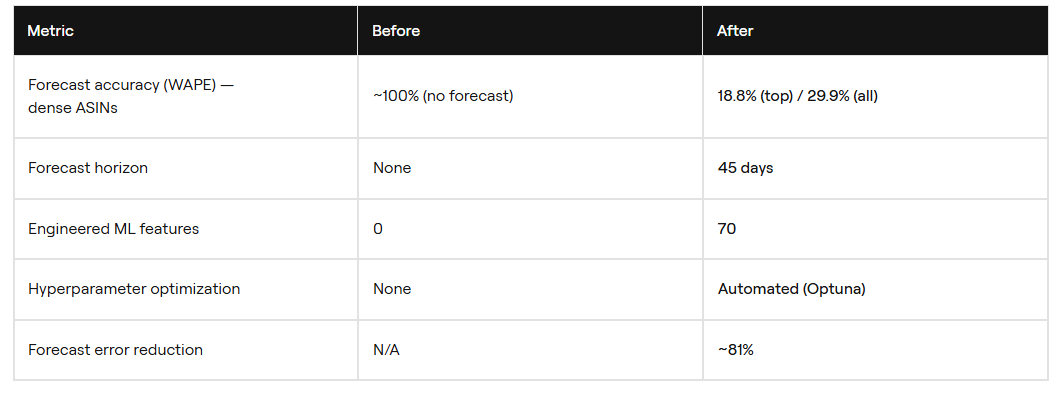
It achieves about 30% WAPE.
Amazon Chronos-2 is a 120M-parameter model fine-tuned with LoRA.
It achieves about 29% WAPE. For sparse ASINs, a dedicated binary classifier predicts 7, 14, and 30-day sale probability.
Its AUC scores range from 0.878 to 0.889. Trained on 70 engineered features drawn from 18 months of data, the ensemble achieves 18.8% WAPE on top ASINs and 29.9% overall.
Business logic layers
On top of the forecasting layer, we built a set of business logic systems to drive real purchasing decisions. Dump signal guardrails flag liquidation candidates using four signals. These signals are demand decline, seasonal timing, competition growth, and inventory depth.
The automated PO engine uses Newsvendor optimization with a 45-day sell-through cap across five checkpoints. It includes kill switches that halt orders if margin is negative, the buy box is lost, or data is stale. Final quantities are rounded to meet MOQ rules. Budgets are allocated across the portfolio by urgency, margin, and days to stockout. Sitting alongside this is a market intelligence layer. It scores 1.39 million ASINs on demand, competition, and margin potential. It then produces a ranked list of products worth adding to the catalog.
Conclusion
When everything is wired together, the company gets a daily system that answers key questions. It shows what’s selling and what’s dying. It tells you what to restock and what to dump. It shows how much to buy and when it must arrive. It also suggests new products to consider. All of this is backed by ML forecasts, real-time market data, and hard business constraints.
Islands built this entire system from scratch. It includes the data warehouse and discovery engine. It also includes the ML pipeline and business logic layer. We didn’t hand off requirements to a vendor or plug into a SaaS tool. We built each layer to fit this business’s needs. It has strict API rate limits. Enrichment uses tokens and costs money. The data is very sparse. The buying rules are complex.
Database: PostgreSQL
Data Sources: Amazon SP-API, Keepa API | ML Models: LightGBM, Amazon Chronos-2 with LoRA, Binary Classifier.
Optimization: Optuna for hyperparameter search | Ensemble: Per-ASIN model selection.
Architecture: 3-layer warehouse (Dimensions → Raw Facts → Daily Aggregates)
Want to build something?
Let’s talk about what you’re working on next and see how we can help.
Book a call
Ninety-nine point four percent of products showing zero sales is the kind of stat that makes you realize how much work goes into cleaning up data before you can do anything useful with it. Most people think the hard part is the AI models. It's not. It's getting to the point where the models have something reliable to learn from.